PROJECT
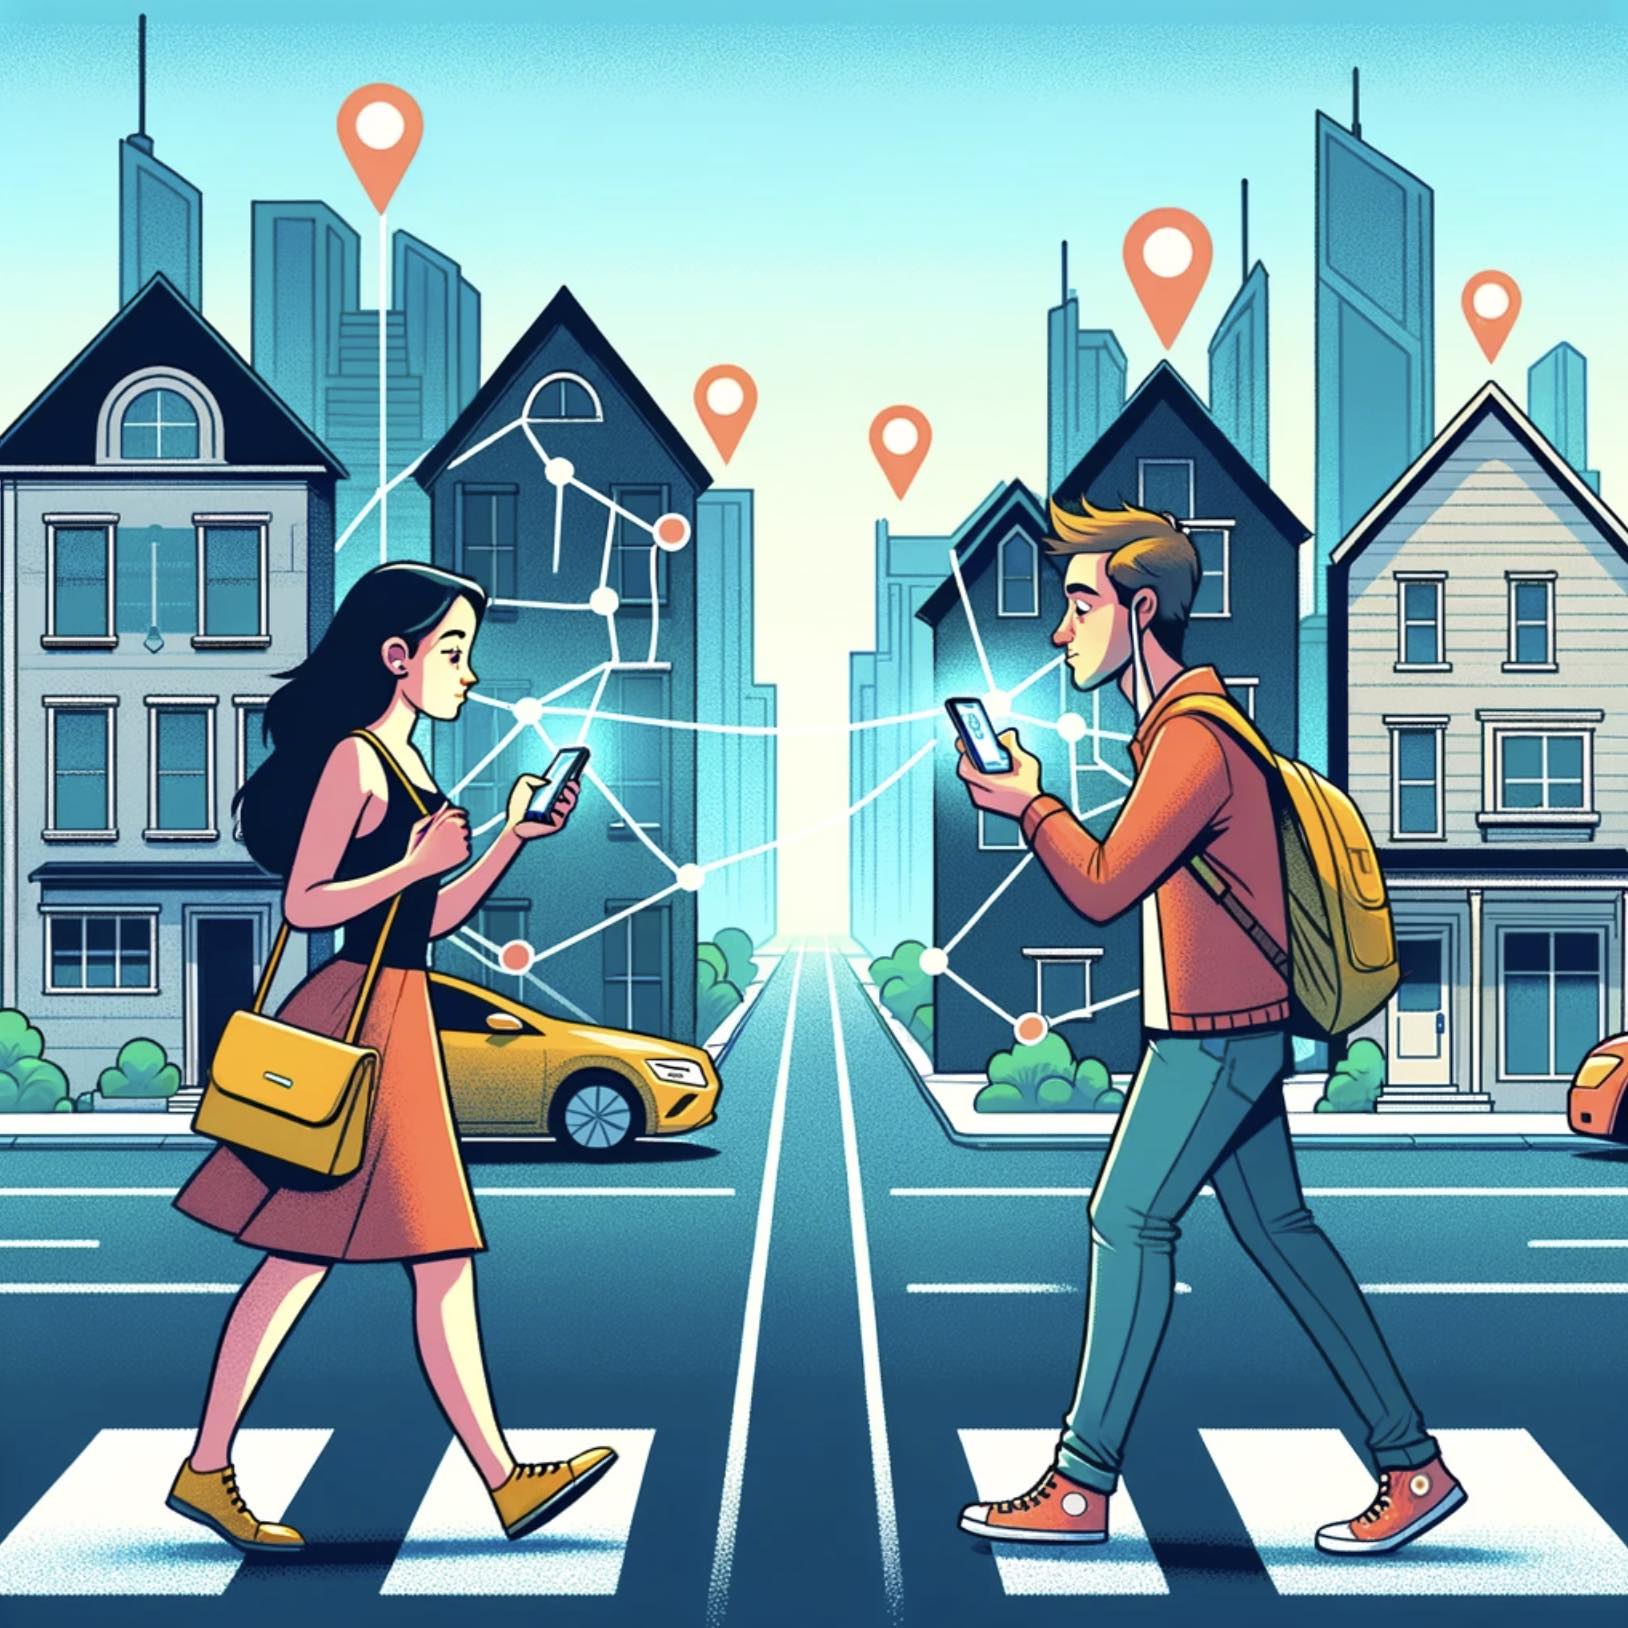
We use cell phone mobility data to develop a measure of exposure segegation: the likelihood of the rich and poor individuals crossing paths and encountering one another within a city or county. We leverage cell phone data from 9.6 million people in the United States to construct a network of 1.6 billion ‘encounters’ (events in which two individuals were in the same place at the same time) across 382 metropolitan statistical areas (cities and their surrounding areas) and 2,829 counties. We infer the socioeconomic status (SES) of each person from their night-time location, cross-referenced with data on rental prices. By linking SES to individual-level encounters, our network enables us to measure the diversity of day-to-day encounters in each city and county.

Key Discoveries
(1) Extreme segregation in large, dense US cities
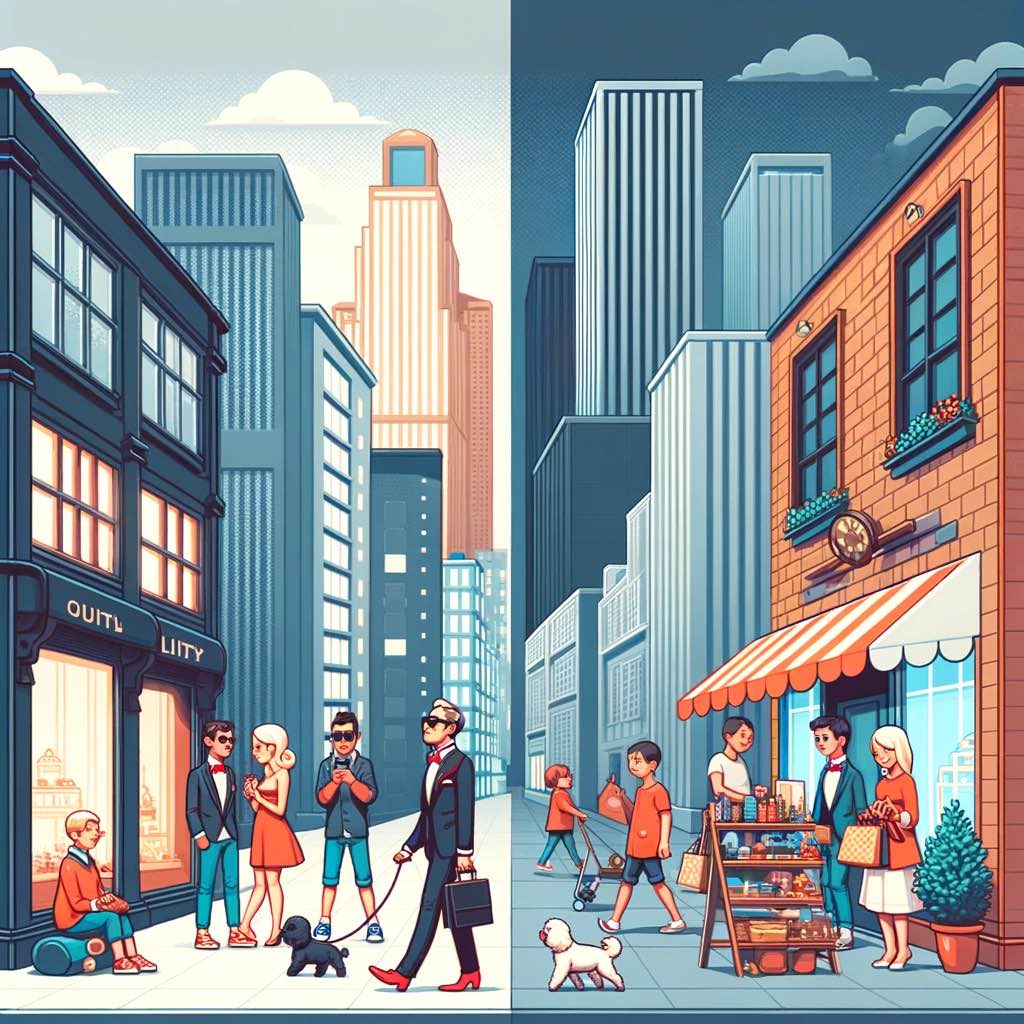
Our main discovery is that exposure segregation is higher in large cities than in small ones. In the ten largest metropolitan statistical areas (cities and their surrounding areas), exposure segregation is 67% higher than in metropolitan statistical areas with fewer than 100,000 residents.
(2) Differentiation of space drives segregation
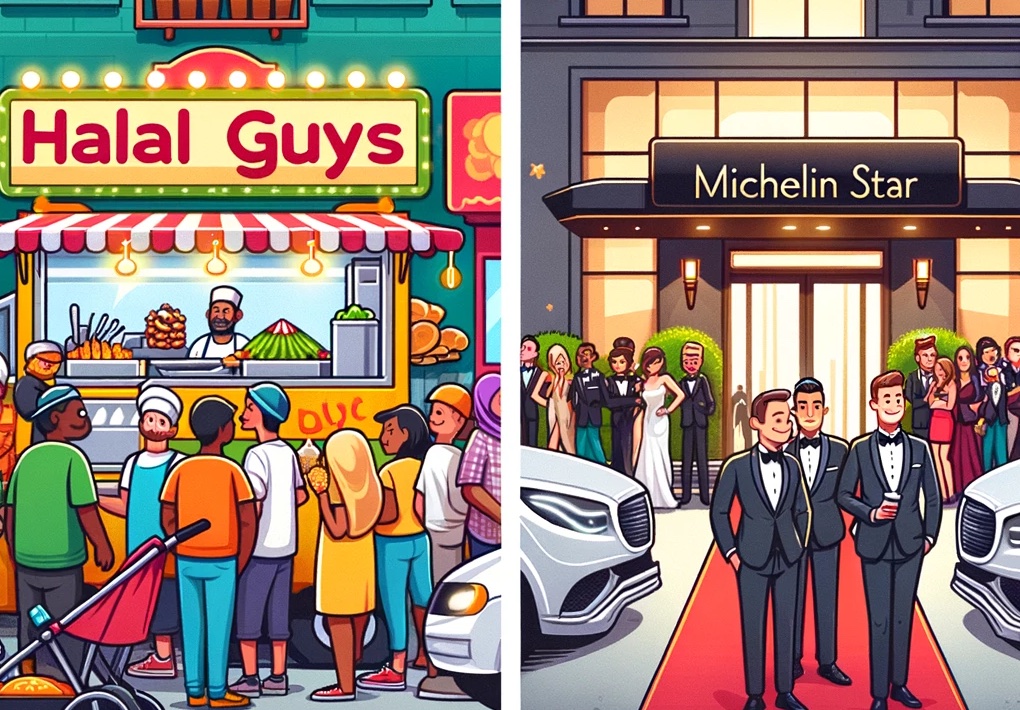
We uncovered the mechanism through which urbanization leads to higher segregation: large cities offer a greater choice of differentiated spaces targeted to specific socio-economic groups. For instance, in large cities like New York, one can spend $10, $100, or $1000 on a meal, depending on the choice of restaurant.
(3) Urban design can bridge diverse neighborhoods
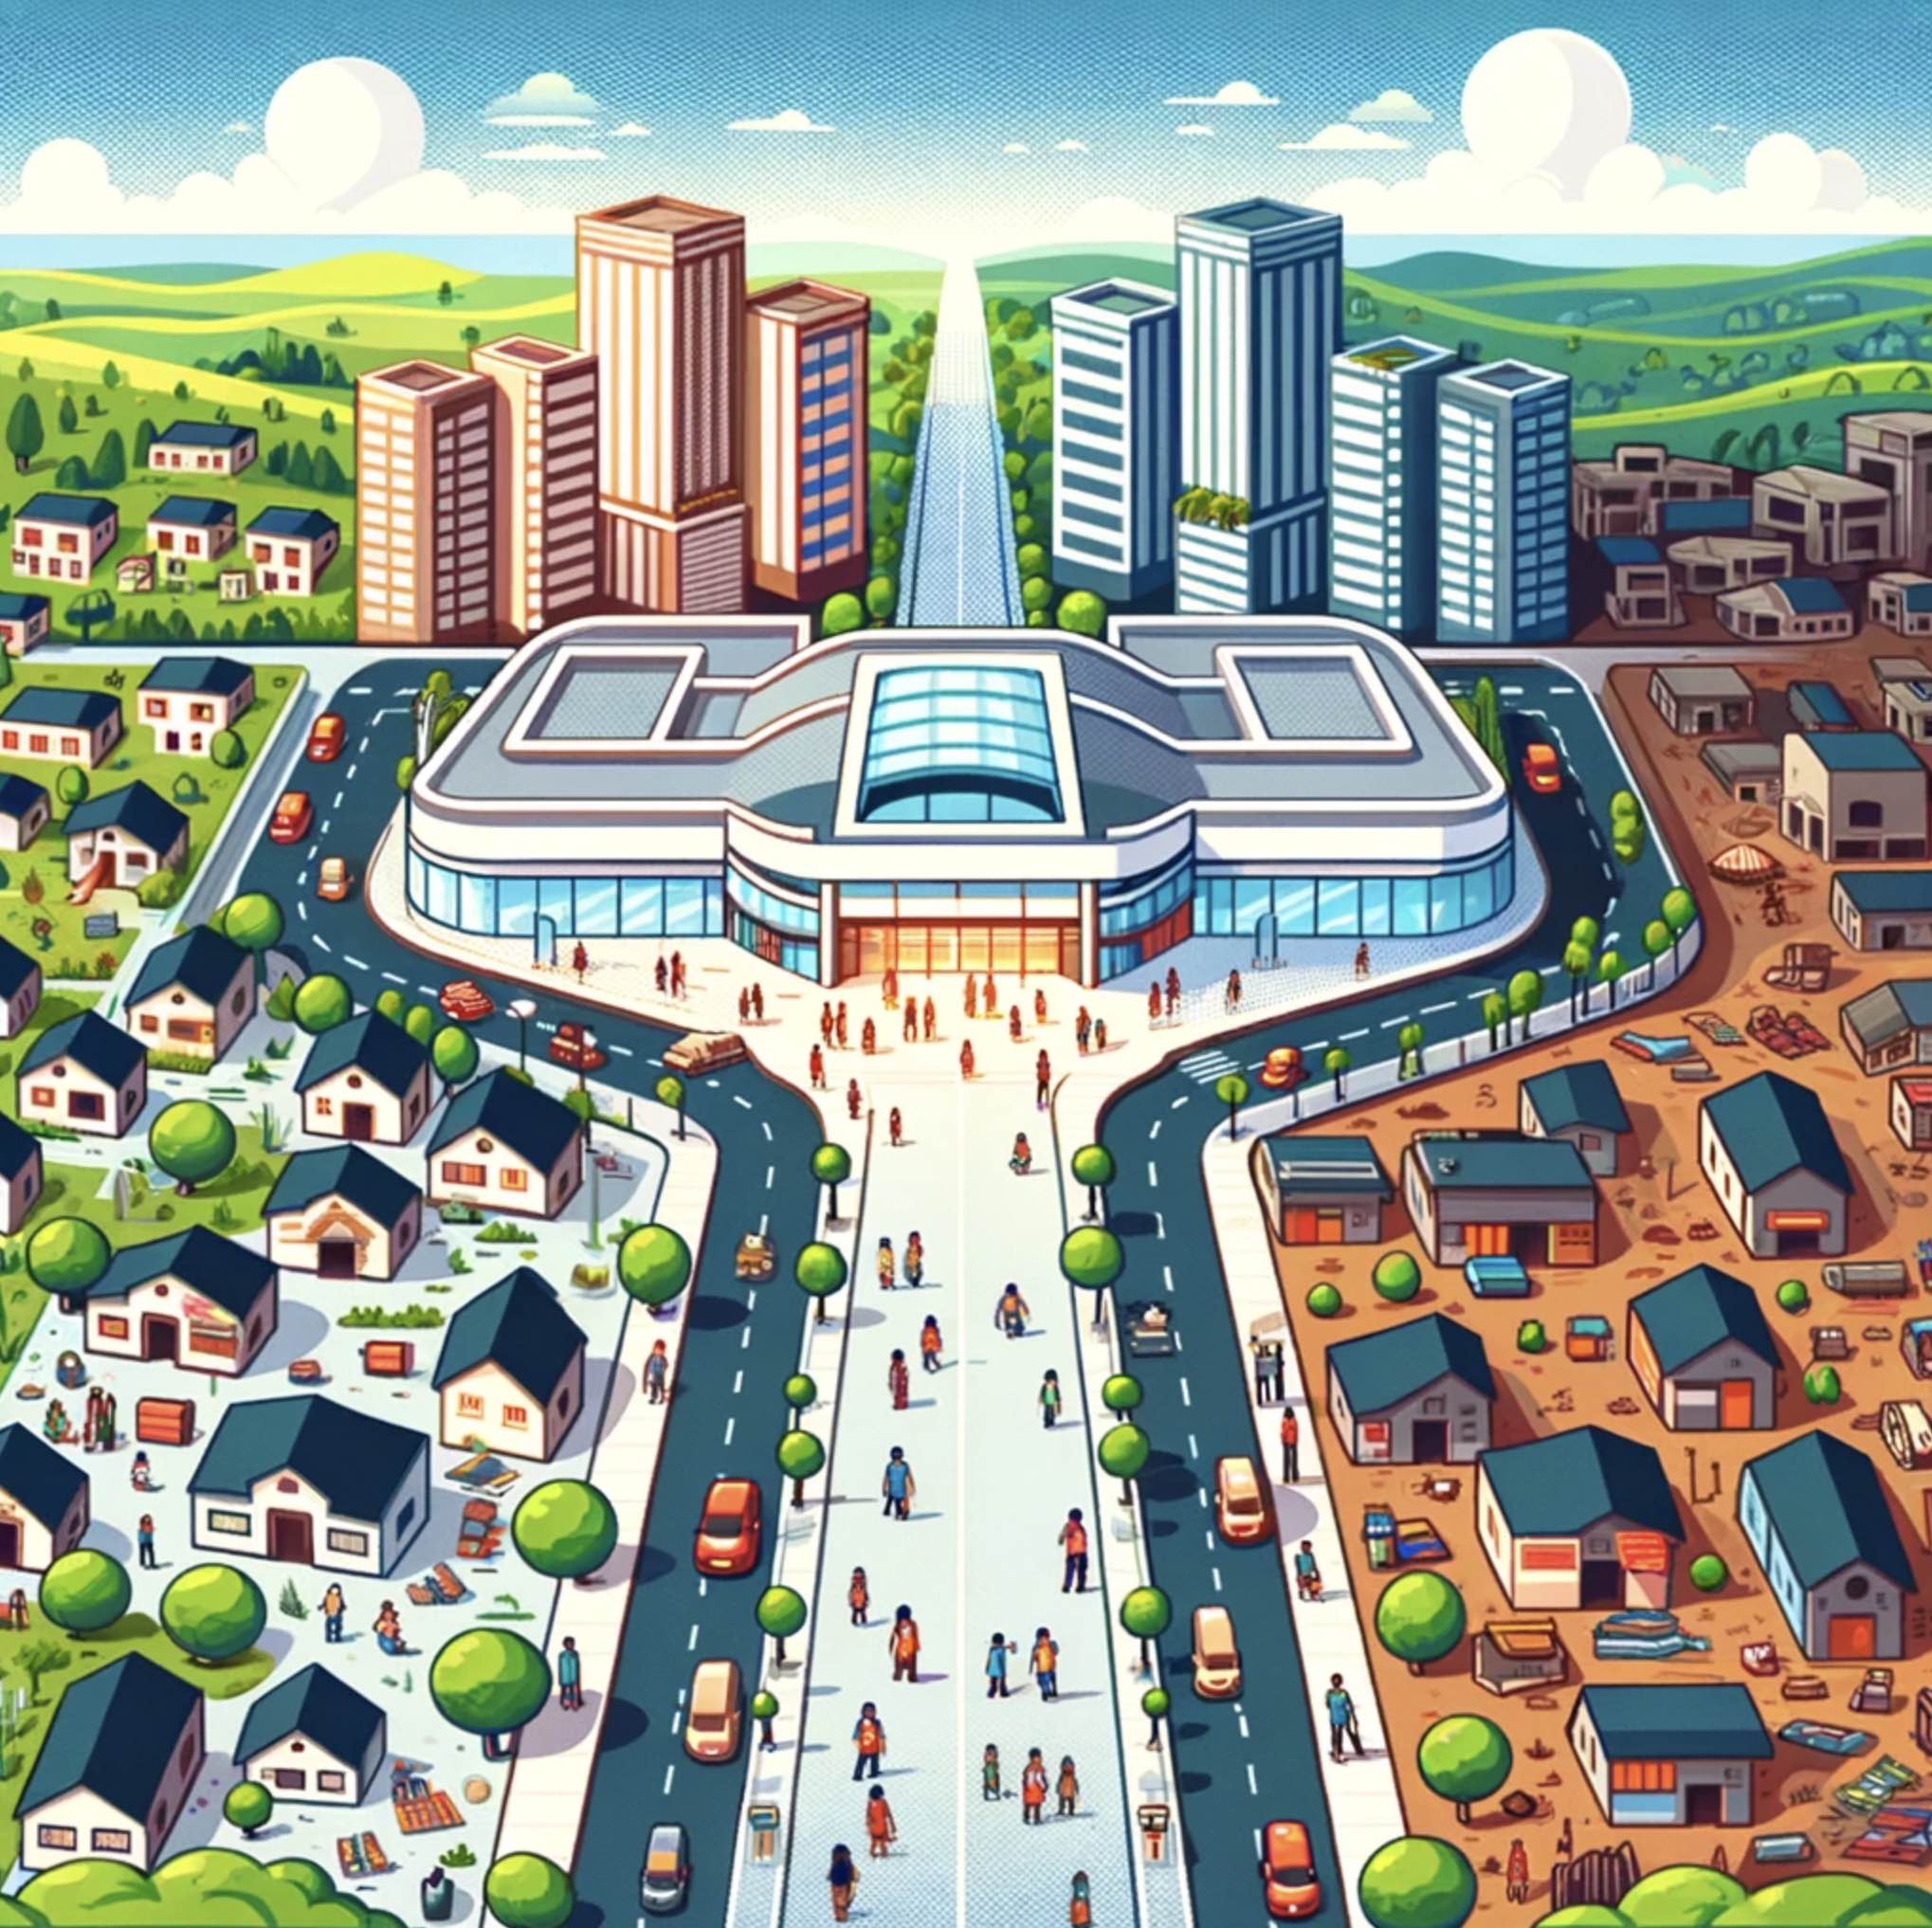
When a city’s hubs (such as shopping malls) are located between lower-income and higher-income neighborhoods, exposure segregation is greatly reduced, because these hubs become meeting places for people from more diverse socio-economic backgrounds.
FAQ
What data do you use?
We use anonymized data from SafeGraph, a company that measures human movement patterns using cell phone data. Our data records, for each anonymized individual, their GPS ping locations and the timestamp for each ping.
What time period do you analyze?
We analyze data from three evenly spaced months in 2017: March, July, and November.
How do you identify socioeconomic status at the individual-level?
For each individual, we first infer their home location from their stationary pings at night and in the early morning (6PM to 9AM). We then recover the estimated monthly rent value of the home at this location, using the Zillow API.
How do you identify encounters?
We identify encounters as each event when two individuals were approximately located at the same place, at the same time. For our primary analyses, we focus on events when two individuals crossed paths and were exposed to each other (i.e., they were less than 50 meters apart within a 5-minute window). This is the highest-resolution measure of exposure in any mobility-based study of segregation to date. We focus on path crossings because the assumption that big cities lead to diverse interactions is based on the premise that in large cities the combination of increased population diversity, constrained space, and accessible public transportation will bring diverse individuals into close physical proximity with one another. However, all of our findings persist under stricter time, distance, and tie-strength thresholds as well.
What about stronger forms of interactions, such as between friends?
Our measure of exposure is also linked to deeper interactions: it strongly predicts friendship ties from a large-scale external dataset compiled by other scholars (Spearman Corr 0.73-0.86; Extended Data Figure 2). In our extended analyses, we show that our key discoveries persist under stricter definitions of exposure (e.g., 10 meters distance within a 1 minutes window), and tie strength (repeated exposure and prolonged exposure).
What can policy-makers do to mitigate segregation?
We discover that when key meeting places (such as shopping malls) are located between diverse neighborhoods, segregation is greatly reduced. We thus recommend zoning laws and related policies that encourage developers to locate hubs, such as shopping centers between diverse residential neighbourhoods. We recommend Fayetteville, N.C as a case study of a city that has done so successfully, because many of its shopping malls, such as the Cross Creek Mall, are located in accessible proximity a diverse range of neighborhoods.
Paper
Click here to read our paper!
Citation: Hamed Nilforoshan*, Wenli Looi*, Emma Pierson*, Blanca Villanueva, Nic Fishman, Yiling Chen, John Sholar, Beth Redbird, David Grusky, Jure Leskovec. Human mobility networks reveal increased segregation in large cities. Nature, 2023.
Abstract: A long-standing expectation is that large, dense and cosmopolitan areas support socioeconomic mixing and exposure among diverse individuals. Assessing this hypothesis has been difficult because previous measures of socioeconomic mixing have relied on static residential housing data rather than real-life exposures among people at work, in places of leisure and in home neighborhoods. Here we develop a measure of exposure segregation that captures the socioeconomic diversity of these everyday encounters. Using mobile phone mobility data to represent 1.6 billion real-world exposures among 9.6 million people in the United States, we measure exposure segregation across 382 metropolitan statistical areas (MSAs) and 2,829 counties. We find that exposure segregation is 67% higher in the ten largest MSAs than in small MSAs with fewer than 100,000 residents. This means that, contrary to expectations, residents of large cosmopolitan areas have less exposure to a socioeconomically diverse range of individuals. Second, we find that the increased socioeconomic segregation in large cities arises because they offer a greater choice of differentiated spaces targeted to specific socioeconomic groups. Third, we find that this segregation-increasing effect is countered when a city’s hubs (such as shopping centers) are positioned to bridge diverse neighborhoods and therefore attract people of all socioeconomic statuses. Our findings challenge a long-standing conjecture in human geography and highlight how urban design can both prevent and facilitate encounters among diverse individuals.
Data
Our MSA-level exposure segregation and hub-bridging index estimates are available here. Our county-level exposure segregation estimates are available here.
Individual, anonymized cellphone mobility data are not publicly available to preserve privacy, while mobility data aggregated to the census block group level and SafeGraph places data are commercially available and may be requested for research use. Data handling and analysis was conducted in accordance with Safegraph policies and with the guidelines of the Stanford University Institutional Review Board.
Our code is available on Github.
Media
Stanford Press Release High resolution images
Press kit available upon request.
Direct inquiries to:
Hamed Nilforoshan
hamedn@cs.stanford.edu


Support
H.N. was supported by a Stanford Knight-Hennessy Scholarship and the National Science Foundation Graduate Research Fellowship under grant no. DGE-1656518; and E.P. by a Hertz Graduate Fellowship, a Google Research Scholar award, NSF CAREER 2142419, a CIFAR Azrieli Global scholarship, a LinkedIn Research Award, a Future Fund Regrant and the Abby Joseph Cohen Faculty Fund. This research was supported by DARPA under grant numbers HR00112190039 (TAMI) and N660011924033 (MCS); ARO under grant numbers W911NF-16- 1-0342 (MURI) and W911NF-16-1-0171 (DURIP); NSF under grant numbers OAC-1835598 (CINES), OAC-1934578 (HDR) and CCF-1918940 (Expeditions); NIH under grant number 3U54HG010426-04S1 (HuBMAP); Stanford Data Science Initiative; Wu Tsai Neurosciences Institute; Amazon; GSK; Hitachi; Juniper Networks; KDDI; and Toshiba. The content is solely the responsibility of the authors and does not necessarily represent the official views of the funding entities.